




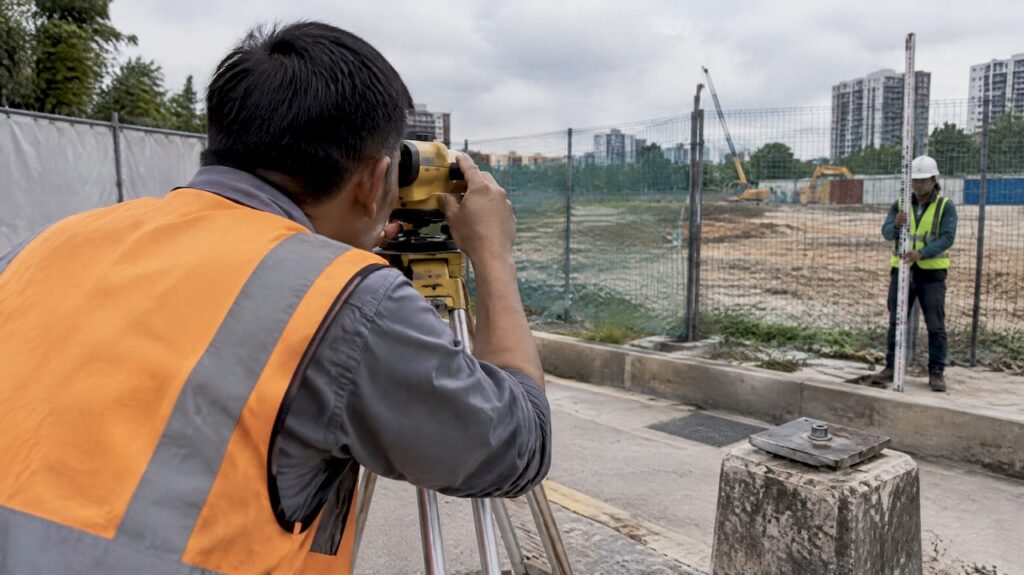
A settlement monitoring plan is a structured program that tracks ground and structure movement through baseline readings, fixed benchmarks, calibrated instruments, defined reading frequencies, trigger levels, and a reporting and response protocol. Before any excavation, piling, or surcharge loading begins, the first action is to establish baseline measurements and a stable reference network outside the zone of influence. Everything that follows, from instrument selection to escalation procedures, depends on that baseline holding steady.
TL;DR:
- Take three independent readings at each monitoring point before construction begins, average them into the baseline, and verify one benchmark against a distant control point.
- Match reading frequency to construction risk: use daily or continuous checks near sensitive foundations, weekly checks for moderate risk, and monthly checks after stability.
- Heavy rainfall, nearby piling, or reported vibration should trigger an unscheduled reading, even when the project’s regular monitoring interval has not elapsed.
- Repeat any anomalous reading and check it against an independent method before escalation, since benchmark movement or instrument faults can mimic real settlement.
- Use manual leveling when readings are infrequent and labor is practical; automated vibrating wire systems suit long programs where frequent site visits cost more.
Table of Contents
- Key components of a settlement monitoring plan
- Selecting instrumentation and measurement methods
- Designing the reference network and establishing baselines
- Measurement frequency, trigger levels and escalation protocol
- Data handling, reporting and visualization
- Quality control, calibration and maintenance
- Sample monitoring schedule and worked example
- Roles, responsibilities and decision steps when movement is detected
- Practitioner perspective: common pitfalls and pragmatic shortcuts
- How Stellar Structures can help implement your settlement monitoring plan
- FAQ
- Sources
Key components of a settlement monitoring plan
A monitoring plan earns its sign-off when it answers a specific set of geotechnical questions before a single instrument goes into the ground. Those questions typically cover expected differential settlement near party walls, consolidation rates under surcharge fills, and the influence radius of excavation support systems. Without this framing, instrumentation choices become guesswork rather than engineering decisions.
The plan also needs a defined project datum, scope, and physical limits, coordinated to the project grid so every reading ties back to the same reference system used in design drawings and survey records. This coordination matters most on sites where multiple contractors or consultants take independent readings; a shared datum prevents conflicting data sets from different teams.
A geotechnical site investigation commissioned early in the project supplies the soil profile and groundwater data that inform where monitoring points should sit and how much movement to expect. The US DOT geotechnical instrumentation module frames this as a systematic planning sequence: define project conditions, predict behavior, select parameters and instruments, then plan data collection and reporting. That sequence, laid out in Chapter 6 of the module, is a practical backbone for any plan regardless of project size.
A complete monitoring plan document should contain the following sections:
- Instrumentation schedule naming instrument types, quantities, and manufacturers for each monitoring location.
- Location drawings showing benchmark and sensor positions relative to the project grid and nearby structures.
- Measurement frequency table tied to construction stage and risk level.
- Trigger level definitions with numeric thresholds for each instrument type.
- Reporting templates specifying tabular and graphical formats for submission.
- Roles and responsibilities matrix naming who reads, reviews, and acts on the data.
- Procurement and budget notes covering instrument costs, installation, and ongoing data management.
Each section should reference the project’s specific geotechnical questions rather than reusing generic boilerplate from an earlier project. A plan built around someone else’s site conditions rarely survives contact with actual field data.
Selecting instrumentation and measurement methods
Instrument selection starts with a comparison between the expected magnitude of movement and the resolution a given sensor can reliably deliver. A site expecting tens of millimeters of consolidation settlement does not need the same resolution as a heritage structure where tolerances sit in fractions of a millimeter.
Common instruments and their typical roles include:
- Settlement plates, read by precise leveling, track vertical ground movement under fills or surcharge loads and remain the most widely used method for embankment and reclamation monitoring.
- Probe extensometers measure settlement at multiple depths within a single borehole, useful where consolidation varies through a soil profile.
- Vibrating-wire sensors, including precision liquid settlement arrays, provide near-real-time readings with long-term stability suited to continuous monitoring.
- Inclinometers record lateral ground or wall movement, a standard pairing with settlement instruments on deep excavation projects.
- Tiltmeters detect rotational movement in adjacent structures, often the first indicator of differential settlement beneath a building.
- Piezometers track pore water pressure changes that frequently precede or accompany settlement in soft ground.
- GNSS and optical leveling survey points across a wider area, cross-checking point-instrument readings against an independent method.
- UAV LiDAR and DEM-based surveys capture site-wide elevation data, filling gaps between discrete instrument locations.
Precision liquid settlement arrays illustrate the resolution available from modern vibrating-wire systems: vendor documentation for one such commercial settlement system describes long-term stability of 0.1% of full-scale output per year, a level of drift control that supports continuous unattended monitoring over multi-year programs.
Access and durability shape the decision as much as raw accuracy. A settlement plate buried under an active construction yard needs a protective casing and a clear reading schedule that avoids plant movement, while a vibrating-wire sensor embedded in a retaining wall needs no physical access at all once cabled to a datalogger. Cost trade-offs follow a similar logic: manual leveling of settlement plates costs little per reading but requires a technician on site every time, while an automated vibrating-wire network costs more upfront but reduces labor over a long monitoring period.
Dataloggers connected to cellular or satellite telemetry allow near-real-time data to reach the project engineer without a site visit, which matters most during high-risk construction stages such as deep excavation or heavy piling near sensitive structures. The trade-off is ongoing connectivity cost and the need for a data management system that can handle continuous streams without burying the engineer in noise. Periodic manual readings remain adequate for lower-risk stages, where a weekly or monthly cadence catches trends without the overhead of a live feed. Combining sparse high-accuracy point instruments with periodic site-wide UAV LiDAR surveys gives both the detail needed for compliance reporting and the spatial coverage needed to catch unexpected movement outside the instrumented zone.
Designing the reference network and establishing baselines
Reference benchmarks only work if they stay still, which means siting them well outside the zone of influence of excavation, piling, or surcharge loading. A benchmark placed too close to the work area moves along with the ground it is meant to measure against, producing readings that look stable while actually drifting with everything around them.
Once benchmarks are sited, the baseline set follows a defined sequence:
- Take three independent sets of readings at each monitoring point before any construction activity begins.
- Average the three readings to establish the base set, a technique LTA’s materials and workmanship specification requires precisely because a single reading cannot distinguish real movement from instrument or survey noise.
- Record the baseline date, instrument serial numbers, and reading conditions in the monitoring log for later reference.
- Verify benchmark stability by cross-checking at least one reference point against a separate, more distant control point.
Before every subsequent reading campaign, the field team should confirm each benchmark remains physically undisturbed: no visible cracking, no recent excavation nearby, no sign of vehicle or equipment contact. Benchmark condition should be logged in every report, not just at baseline, because a benchmark that failed silently halfway through a project invalidates every reading taken after the failure.
Pro Tip: Install at least one backup benchmark pair for every primary reference point; a single lost or disturbed benchmark should never force a restart of the entire baseline.
Measurement frequency, trigger levels and escalation protocol
Reading frequency should track construction risk rather than follow a fixed calendar. High-risk stages, such as excavation adjacent to existing foundations or piling within a sensitive influence zone, call for daily or continuous readings depending on the instrument. Moderate-risk stages, including general earthworks away from sensitive structures, typically justify weekly readings. Low-risk stages, such as a stable period after structural completion, can move to monthly readings without losing the ability to catch a developing trend.
Event-driven readings sit outside the regular schedule entirely. Heavy rainfall, nearby piling, or a reported vibration event each warrant an out-of-cycle reading regardless of where the project sits in its normal cycle. Vibration from nearby demolition or piling work is a frequent trigger for these unscheduled checks, and guidance on vibration monitoring during demolition outlines the kind of event thresholds worth adopting for construction sites facing similar exposure.
A workable trigger structure defines three tiers:
- Alert level: movement approaching a defined fraction of the design tolerance, prompting increased reading frequency and a check of recent construction activity.
- Action level: movement reaching a level requiring engineering review and possible temporary works adjustment.
- Alarm level: movement at or near the design limit, requiring immediate work stoppage and authority notification where the project scope requires it.
Numeric thresholds vary by instrument and project, but the structure should set each tier as a defined percentage of the total predicted movement for that location, calculated during the design-stage prediction described in the US DOT instrumentation module.
| Trigger tier | Typical trigger basis | Immediate action |
|---|---|---|
| Alert | Movement trend approaching design tolerance | Increase reading frequency, review recent works |
| Action | Movement reaching engineering review threshold | Engineering assessment, consider temporary measures |
| Alarm | Movement at or near design limit | Stop work, notify authorities as required |
Each tier carries its own notification chain. An alert typically stays within the monitoring engineer and project engineer; an action level brings in the client representative and the project’s qualified person; an alarm level escalates to site management, the relevant authority, and, where structural safety is in question, an immediate site evacuation decision. Verification before escalation matters just as much as the escalation itself: a single anomalous reading should trigger a repeat measurement before any notification goes out, since a damaged benchmark or instrument fault can mimic real movement.
Data handling, reporting and visualization
A monitoring report earns trust when it shows its working rather than presenting a single summary number. At minimum, every report should include the base set values, a tabulated record of relative movement in millimeters at each point, a plot of movement against time, and a cumulative movement chart that makes long-term trends visible at a glance. LTA’s specification calls for base readings and relative movements expressed in millimeters with graphical representation where required, a format that has become the practical standard across the industry.
Each data file should carry consistent metadata: a timestamp, the instrument identification number, and the date of last calibration. Without this metadata attached at the point of collection, a reviewer has no way to judge whether an unusual reading reflects real movement or a sensor due for recalibration.
A monitoring report package typically contains:
- A summary table of current readings against baseline and against the previous reporting period.
- Time-series plots for each monitoring point, grouped by zone or structure.
- A cumulative movement chart comparing actual values against predicted and trigger thresholds.
- A short narrative commentary explaining any anomalies or trends worth flagging.
| Report element | Format | Update frequency |
|---|---|---|
| Base set table | Tabular, mm | Set once, referenced in every report |
| Relative movement table | Tabular, mm | Each reporting cycle |
| Time-series plot | Graph | Each reporting cycle |
| Cumulative chart | Graph | Each reporting cycle |
Spatial data from UAV LiDAR or total-station surveys benefits from a different visualization approach: DEM differencing between survey epochs, rendered as a heatmap, highlights where settlement concentrates across a site rather than at a single point. A UAV LiDAR case study found that a 50 centimeter DEM grid reliably detected site-wide consolidation trends and revealed differential monthly deviations worth flagging for further investigation. Quality checks on this data should confirm consistent flight parameters and ground control points between epochs, since inconsistent survey conditions can produce apparent movement that is really a processing artifact.
Quality control, calibration and maintenance
Every instrument should carry a factory calibration certificate before installation, and vibrating-wire or electronic sensors benefit from an on-site verification reading against a known reference before they go into service. This two-step check catches shipping damage or drift that a factory certificate alone cannot reveal.
Ongoing field quality control relies on repeatability: taking a second independent reading at a sample of points during each campaign confirms the instrument and the reading technique remain consistent. Cross-method verification adds another layer of confidence, comparing settlement plate leveling results against GNSS or total-station checks at the same point catches sensor drift that a single method would miss on its own.
Maintenance needs differ by instrument type:
- Settlement plates need periodic inspection for casing damage and sediment buildup around the base.
- Vibrating-wire sensors and dataloggers need battery and connectivity checks on a schedule matched to the telemetry system’s reporting interval.
- Survey benchmarks need a physical condition check before every reading campaign, not just an annual review.
- Inclinometers and piezometers need periodic verification against manufacturer tolerance limits, with replacement scheduled once drift exceeds the stated resolution.
Any anomaly, whether a sudden jump, a flatlined reading, or a value inconsistent with a cross-check, should be documented with the date, suspected cause, and resolution before it disappears from the data record. A monitoring program’s credibility rests as much on how it handles its own errors as on the accuracy of its instruments.
Sample monitoring schedule and worked example
The following illustrative schedule shows how a mid-sized excavation project might structure instrumentation over an 18-month program. These figures are an example for planning purposes, not a universal standard, and should be adjusted to the specific site’s predicted movement and risk profile.
| Construction stage | Instrument type | Locations | Frequency |
|---|---|---|---|
| Pre-construction (months 1-2) | Baseline survey, all instruments | All points | Base set (3 readings) |
| Excavation (months 3-8) | Inclinometers, settlement plates, tiltmeters | High-risk zone | Daily to weekly |
| Structural works (months 9) | Settlement plates, piezometers | All zones | Weekly |
| Post-completion (months 18) | Settlement plates, survey check | All zones | Monthly |
An interim report entry for a single settlement plate might show a base set average of 0.000 millimeters, a reading at month 6 of 4.2 millimeters, and a reading at month 9 of 7.8 millimeters, each tied back to the same datum and flagged against the alert threshold set during design. The narrative accompanying that table would note the construction activity underway during each reading period, since a jump coinciding with nearby piling tells a different story than the same jump during a quiet period.
Readers planning a similar program often need the underlying soil data before finalizing instrument placement; our guide to soil investigation report preparation covers the inputs that feed directly into predicting expected settlement magnitudes. For projects involving deep excavation support, our value engineering guide for deep excavations covers how strutting design decisions interact with the monitoring data collected during excavation stages. Readers looking to adapt the schedule above to a specific site may request a tailored template from a professional engineering team.
Roles, responsibilities and decision steps when movement is detected
A monitoring plan needs named roles, not job titles borrowed from an org chart that nobody on the project actually follows. The field technician takes readings and performs the first-level check against the previous value. The monitoring engineer reviews incoming data, confirms trigger status, and decides whether a reading needs repeating before escalation. The project engineer holds responsibility for engineering judgment once a trigger tier is reached, and the client representative needs visibility at the action level and above. A qualified person or professional engineer signs off on any decision involving temporary works adjustment or authority notification.
When movement crosses a trigger tier, the response follows a defined sequence:
- Verify the reading through an immediate repeat measurement at the same point.
- Cross-check against an independent instrument or method where available.
- Notify the monitoring engineer and project engineer per the escalation chain for that tier.
- Assess whether temporary measures, such as reduced excavation rate or additional propping, are warranted.
- Notify the relevant authority where the exceedance affects public infrastructure or falls within a statutory reporting requirement.
- Document the verification steps, decision, and any temporary measures taken in the monitoring log.
A minimal evidence package for any escalation should include the verified reading, the previous three readings for trend context, and a note on construction activity in the preceding 48 hours. Our guide on civil and structural design checks outlines the kind of independent verification a project engineer can call on when a monitoring trigger raises questions about structural capacity rather than ground movement alone.
Practitioner perspective: common pitfalls and pragmatic shortcuts
The most frequent program failure is not an instrument fault but a benchmark placed too close to the work it is meant to measure against. A reference point sited inside its own zone of influence produces data that looks clean right up until someone notices the whole trend is inverted. The second most common failure is relying on a single measurement method where redundancy would have caught the problem early: a settlement plate without a periodic leveling cross-check has no way to flag its own drift.

A pragmatic shortcut worth adopting on smaller projects is a minimum viable instrument set, a handful of settlement plates and one inclinometer at the highest-risk location, rather than instrumenting every point the specification allows. Early stakeholder buy-in on trigger levels matters more than instrument count; a client who understands what an alert tier means before it happens responds faster than one seeing the term for the first time mid-project.
Documentation habits separate a defensible monitoring program from one that collapses under scrutiny after an incident. A log that records benchmark condition, instrument serial numbers, and verification steps at every reading is the difference between a program that can explain an anomaly and one that can only guess at it later.
— Aman
How Stellar Structures can help implement your settlement monitoring plan
Turning the checklist above into a sign-off-ready document takes more than a template; it takes engineering judgment applied to your specific soil conditions, structure types, and authority requirements. We provide structural and geotechnical engineering consultation that covers monitoring-plan drafting, instrumentation selection, and trigger-level calculation tailored to the actual predicted movement on your site.

Where a project also needs statutory sign-off, we handle the full range of authority submissions, including BCA, URA, LTA, and SCDF approvals, alongside periodic structural and façade inspections once construction is complete. Our structural and geotechnical engineering consultation service covers monitoring-plan development from the baseline stage through to final reporting, so your team is not left reconciling instrument data with authority requirements on its own. Reach out through our services page to request a monitoring-plan proposal or a site review scoped to your project’s risk profile.
FAQ
What are the different types of settlement in soil?
Soil settlement generally falls into three categories: immediate settlement, which occurs quickly as load is applied; consolidation settlement, which develops over time as pore water drains from fine-grained soils; and secondary compression, a slower, longer-term settlement that continues after consolidation is largely complete. A monitoring plan needs to account for which type dominates on a given site, since each produces a different time-rate curve.
What is a project monitoring plan?
A project monitoring plan is a documented program defining what will be measured, how often, by what methods, and who responds when measurements cross defined thresholds. For settlement specifically, it ties baseline readings, instrumentation, and reporting formats to the construction schedule so that movement is tracked against predicted behavior at every stage.
What is geotechnical monitoring?
Geotechnical monitoring is the ongoing measurement of ground and structure behavior, including settlement, lateral movement, pore pressure, and vibration, during and after construction. It relies on instruments such as settlement plates, inclinometers, and piezometers to verify that actual site behavior matches the assumptions used in design.
How do I monitor building movement?
Building movement is typically tracked with tiltmeters for rotation, settlement markers or precise leveling for vertical movement, and crack monitors where visible distress has already appeared. Readings are compared against a baseline established before nearby construction begins, with increased frequency during high-risk stages such as adjacent excavation.
What instruments are used for settlement monitoring?
Common instruments include settlement plates, probe extensometers, vibrating-wire or liquid settlement arrays, inclinometers, tiltmeters, piezometers, and survey-based methods such as GNSS, optical leveling, and UAV LiDAR. Instrument choice depends on the expected magnitude of movement, required resolution, and whether continuous or periodic readings are needed.
Sources
- Materials & workmanship specification (LTA) — instrumentation and monitoring
- Geotechnical Instrumentation: systematic approach to planning monitoring programs (US DOT)
- UAV LiDAR–based 3D point cloud processing for monitoring consolidation settlement during construction (Springer, 2025)
- Precision Liquid Settlement Array (RST / Orica product page)
Recommended
- The Homeowner’s Guide to Foundation Underpinning and Settlement Repair in Singapore
- Soil Improvement for Singapore’s Challenging Ground
- Singapore Marine Clay & Property Settlement: Guide for Homeowners (2025)
- Geotechnical Site Investigation in Singapore: